Lighthouse: Building our own Webpage Performance Analyzer

If you’re a web developer, I’m willing to bet you’ve used Lighthouse at least once. Especially when your company suddenly has an epiphany and realizes that things for a website like performance, SEO and accessibility are important.
When it comes to a website’s performance, there is no other tool that comes even close to it, it has been the go-to for performance tests and getting some really good insights to improve common pitfalls. And the insights are not just limited to performance, Lighthouse even tells you if your website is lacking in Accessibility or SEO and if it is a PWA.

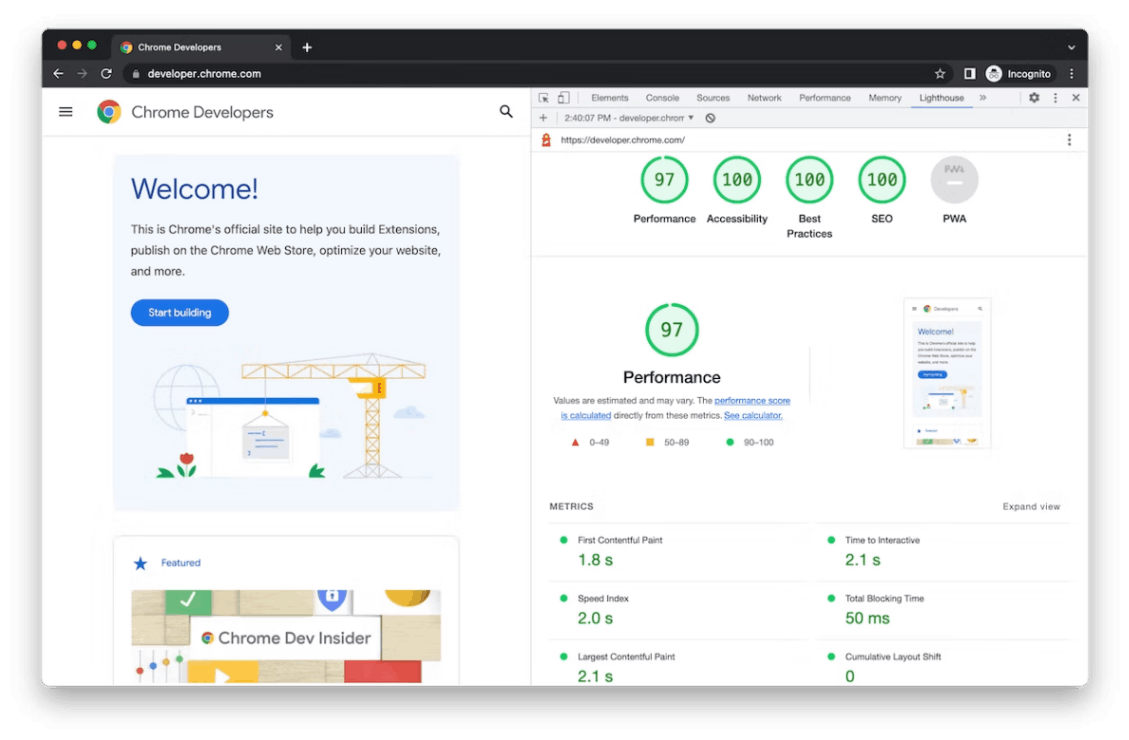
The Chrome team has done an amazing job of enabling Lighthouse in their Chrome builds, so today you can run it in your Web Browser (As seen in the screenshot above).
If you know me, a tool like this would get me asking “What goes behind the scenes to make it happen?”. In this post, we’ll rebuild a performance analyzer similar to Lighthouse, we’ll be replicating functionality, not copying implementation outright as Lighthouse is anyway open-source for everyone to go have a look.
A quick overview of how Lighthouse opens your site and measures performance
For all the users running Lighthouse inside their browser console, the logic is simple, being part of your browser gives the Lighthouse tool all the access it needs to the website currently open and the browser APIs required to measure performance.
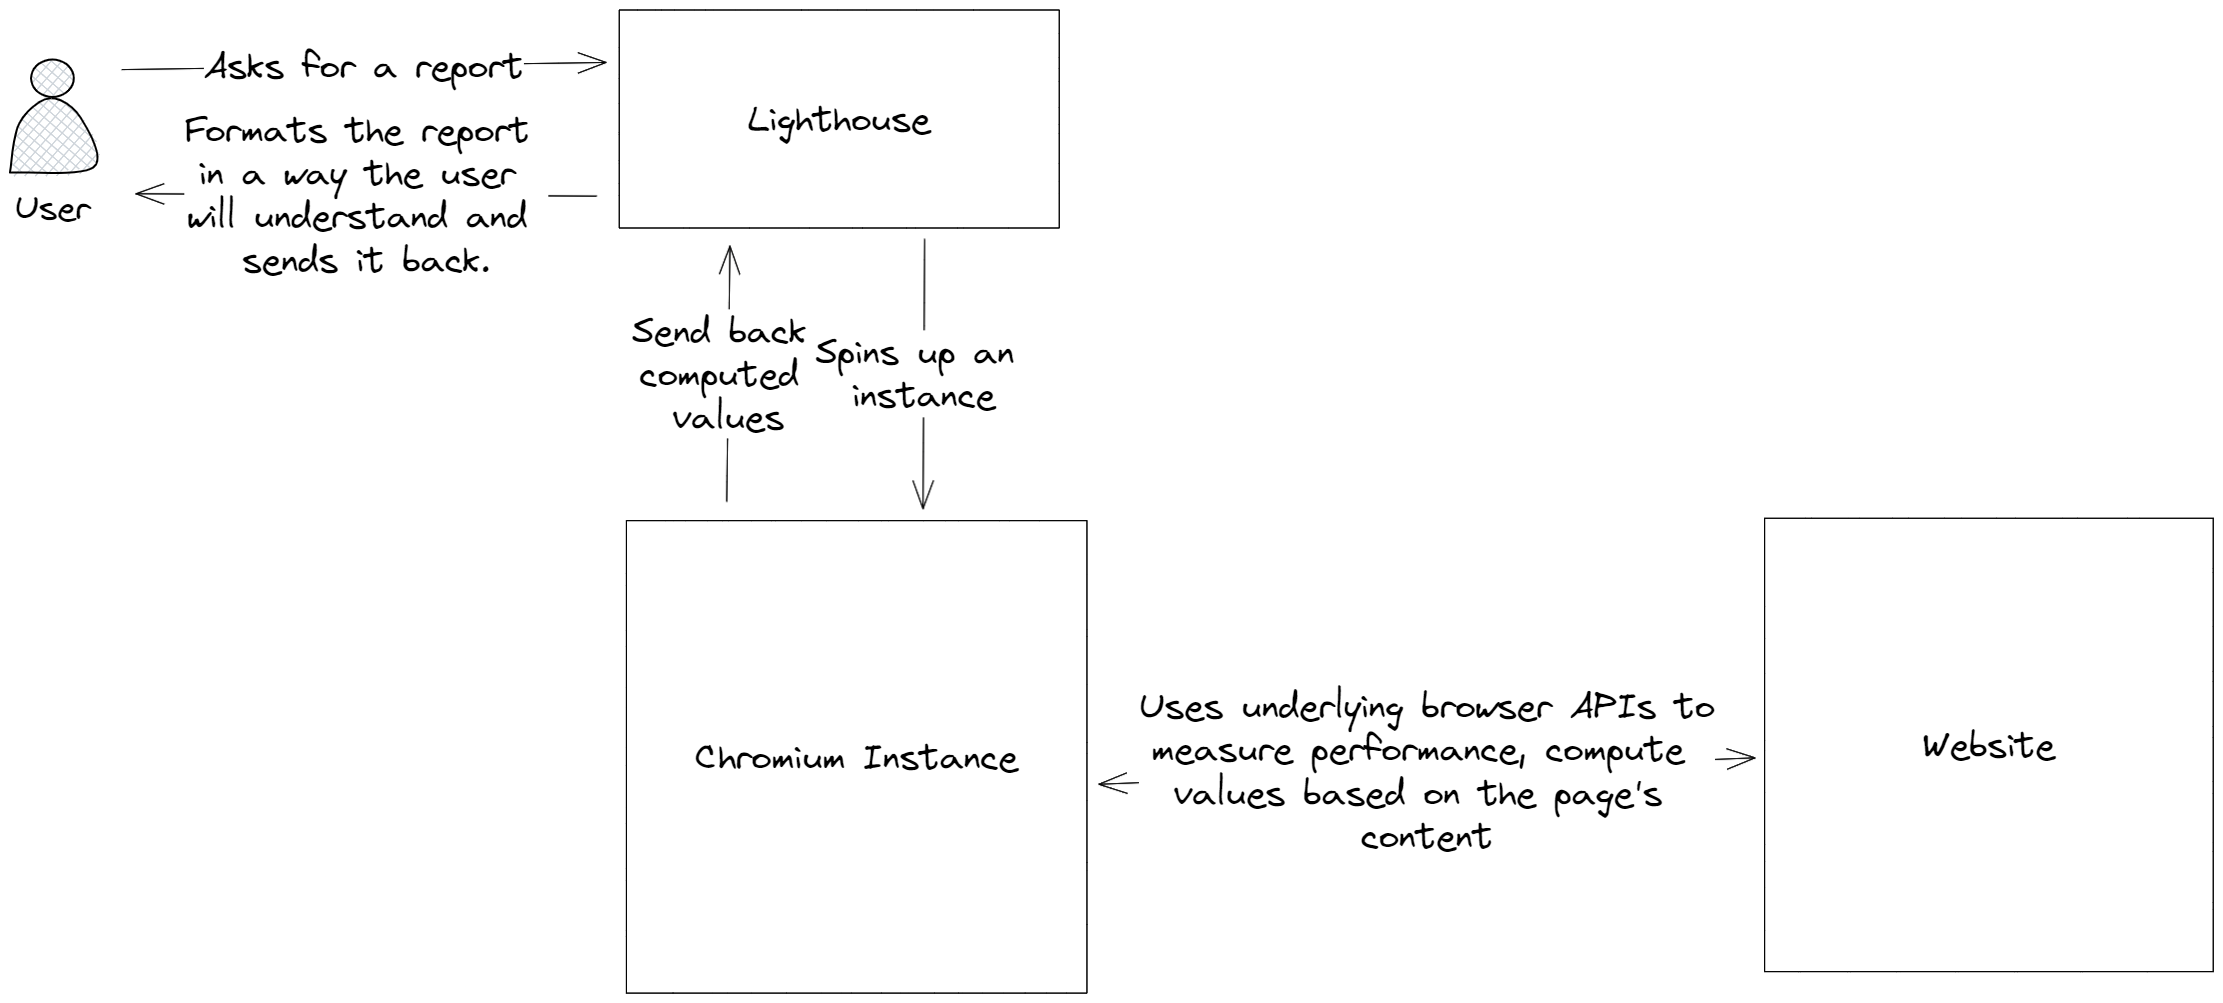
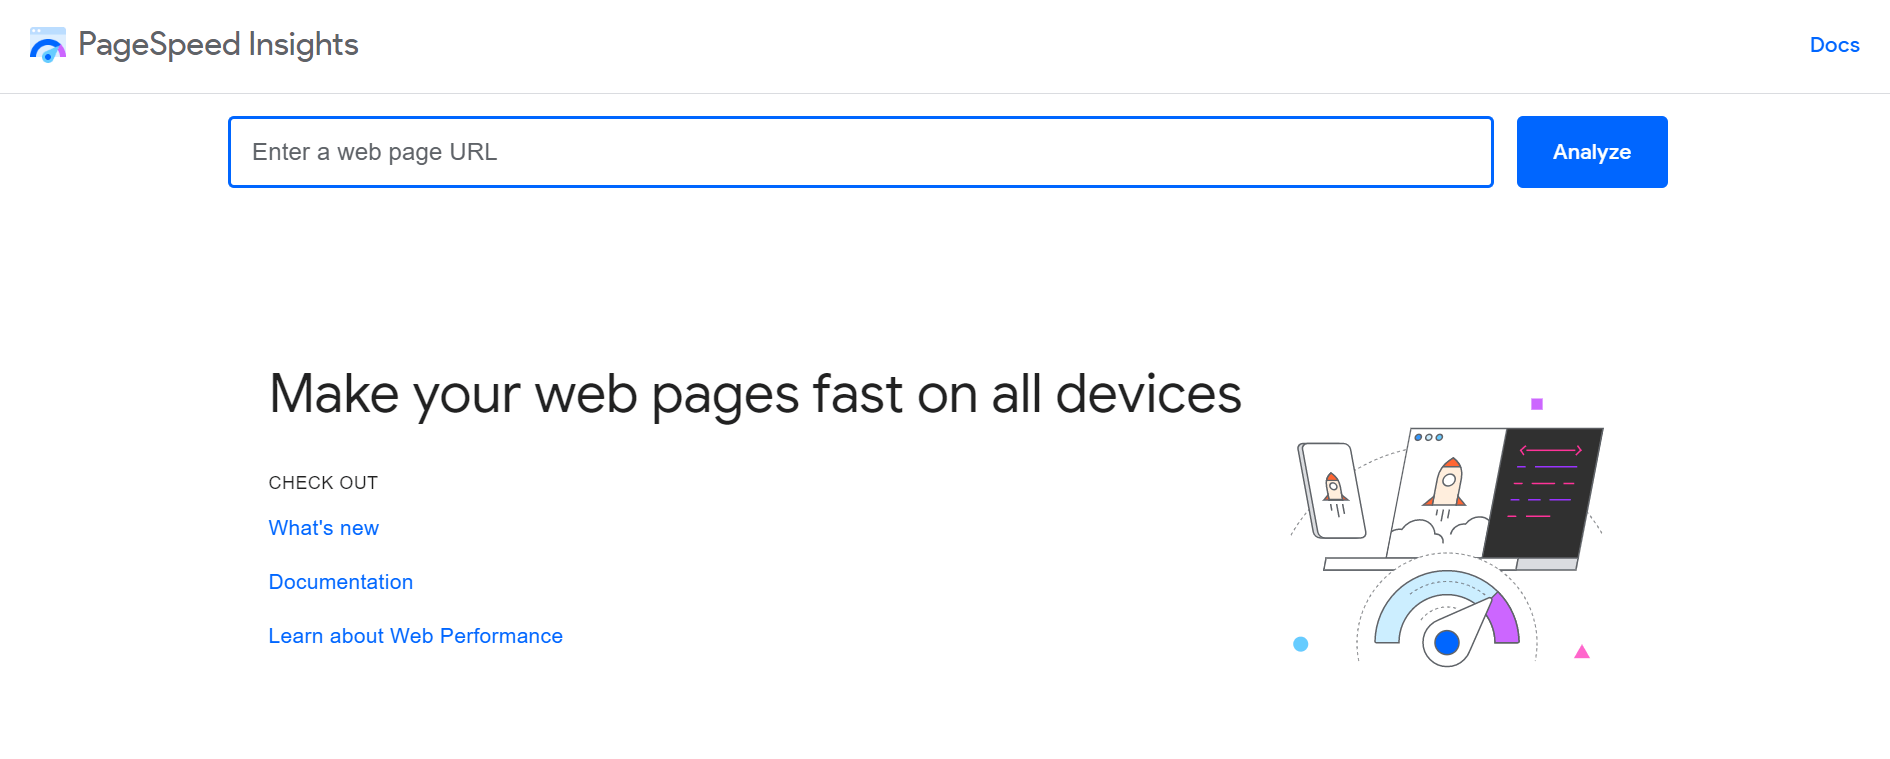
However, for the performance analysis one does on Pagespeed Insights (A website to run Lighthouse on your website), the following flow is what happens when you enter your website URL and press on Analyze.

Scope of what we’re building
It’s impossible to build the entirety of the Lighthouse.
You can’t build in a few days, what’s taken years to finesse.
So we’ll narrow down the scope of what we need to build to focus only on those aspects.
- We will not be running accessibility, best practices, SEO and PWA tests (Let’s keep that for a separate post 😉)
- We will only focus on performance analysis which comprises the following:
- Screenshots at regular intervals till the page loads to give the user an idea of how their website will feel to the end user.
- Web Vitals like FCP, LCP, CLS, TTFB and Total Blocking Time (We’ll not be measuring Speed Index as it’s one of those metrics everyone simply wonders “What’s it’s purpose again?”)
- Other useful metrics like the amount of JavaScript loaded, and total blocking time.
- List and sizes of assets loaded over the network after page load.
What we’ll be using
To build our Lighthouse clone, we’ll use:
- A simple Node.js and Express server which will expose an API endpoint to make requests to get a website’s performance insights.
- Puppeteer heavily for opening a website, taking screenshots through the page’s lifecycle, and getting access to the underlying Chromium instance APIs for performance and metrics.
- A simple HTML and CSS page on the front end to make a call to our backend API and trigger a performance test.
Spinning up a Chrome instance to launch the website
Now there are many ways to spin up a Chrome instance to test the website, one could install a build of Chromium itself and use its amazing APIs to do everything from scratch, but I don’t want to reinvent the wheel, so I would be using the amazing Puppeteer that exposes a lot of page loading and lifecycle APIs for us to use.
Puppeteer’s original use case is web scraping but no one ever said we can’t use it for something else.
app.post("/measure", async (req, res) => {
    if (!req.body.url)
	return res
		.status(400)
		.json({ message: "Incomplete input", error: "URL not provided." });

    const browser = await puppeteer.launch({
	headless: false,
	args: ["--no-sandbox", "--disable-setuid-sandbox", "--single-process",	"--no-zygote" ],
    });
    const devicesAvailableToEmulate = puppeteer.KnownDevices;
    const page = await browser.newPage();
}
Emulating a Device
We can emulate pretty much any device we want with Puppeteer. Lighthouse uses a mobile device for benchmarking website performance, which we’ll use here.
const devicesAvailableToEmulate = puppeteer.KnownDevices;
await page.emulate(devicesAvailableToEmulate["iPhone 13 Pro Max"]);
Throttling Network Speed
Lighthouse also throttles the network speed to make the results of performance tests close to how your real-world end users would experience your site.
We can do the same for our set-up using Puppeteer, it provides a neat functionality to start a Chrome Dev Tools (CDP) session (Your Browser console) to set an artificial speed for download and upload.
const devToolsClient = await page.target().createCDPSession();
// Set network throttling
await devToolsClient.send("Network.emulateNetworkConditions", {
	offline: false,
	downloadThroughput: (10 * 1024) / 8,  // 10 Megabits/second
	uploadThroughput: (2 * 1024) / 8,  // 2 Megabits/second
	latency: 20,
});
Do make sure to have a timeout since at slower internet connections, websites can have an extremely long load time.
Taking Screenshots throughout the page load cycle
We will utilize puppeteer’s inbuilt screenshotting API, and we will take 10 screenshots across the page’s load and settle lifecycle.
And right before sending our response, we’ll take one last screenshot.
The process is fairly simple:
- Mount a loop that runs 10 times, with a gap of 500 milliseconds, from the moment the page starts to load.
- Take a screenshot on every iteration and convert the screenshots to base64 so they can be sent over the network and can be displayed by the end user’s browser.
- Right before sending the response, take one last screenshot to show the completed state of the web page.
To achieve this effect, we’ll use a closure function which mounts the timeouts to take screenshots and returns an object, containing a function to get the final resolved list of screenshots, and also to take one last screenshot.
const takePageScreenshotsAtRegularInterval = (page, { requestStartTime }) => {
	const screenshotPromises = [];
	let pageOpen = true;

	page.on("close", () => (pageOpen = false)); // For any reason or errors, the browser might disconnect or close.

	const createScreenshotTakingPromise = (timeout, quality = 10) =>
		new Promise((resolve) => {
			setTimeout(async () => {
				const screenshotTime = new Date().getTime() - requestStartTime;
				let screenshot = null;
				if (pageOpen)
					screenshot = await page.screenshot({
						encoding: "base64",
						type: "webp",
						quality,
					});
				resolve({ screenshot, time: screenshotTime });
			}, timeout);
		});

	const nScreenshots = SCREENSHOTS_ALLOWED_TILL_MS / SCREENSHOTTING_INTERVAL;
	for (let i = 0; i < nScreenshots; i++)
		screenshotPromises.push(
			createScreenshotTakingPromise(i * SCREENSHOTTING_INTERVAL)
		);

	return {
		takeOneLastScreenshot: () => {
			// For use when page has completely loaded.
			screenshotPromises.push(createScreenshotTakingPromise(0, 40));
		},
		getAllTakenScreenshots: async () => {
			return (await Promise.allSettled(screenshotPromises)).map(
				(screenshotResolvedPromise) => ({
					screenshot: screenshotResolvedPromise.value.screenshot,
					time: screenshotResolvedPromise.value.time,
				})
			);
		},
	};
};
const { getAllTakenScreenshots, takeOneLastScreenshot } =
		takePageScreenshotsAtRegularInterval(page, { requestStartTime });
...
takeOneLastScreenshot();
...
const screenshots = await getAllTakenScreenshots();
The screenshots result above is an array with screenshot base64 string and a time value in milliseconds to tell at what point the screenshot was taken at during the page load cycle.
Measuring Web Vitals
The most important part of the Lighthouse performance report is the web vitals list, namely First Contentful Paint, Largest Contentful Paint, Cumulative Layout Shift, First Input Delay and Total Blocking Time.
Now we could go reinventing the wheel, and calculating all those metrics ourselves, but there’s a simpler solution to get Web Vitals, and that’s via the amazing Web Vitals package.
Puppeteer allows us to inject scripts via script tags into our pages during evaluation, which conveniently allows us to do the following:
- Inject the web vitals package script
- Wait for the package script to load on the target web page using Puppeteer’s
waitForFunctionAPI. - Use puppeteer’s
evaluateAPI that allows us to run a script in the page’s context (which means we’ll have access towindow.webVitalsinside the block, think of it like opening the browser console and executing JavaScript code inside it) and expose the vitals to the global scope. - Assess the target element that can be attributed to certain metrics like LCP and CLS.
- Export the values to our controller and send them back in the response.
Note that:
- For metrics like FID, and CLS there has to be a visibility change event, which means that the tab has to be switched for those metrics to be populated with values. We’ll use Puppeteer’s
newPageAPI to create a new tab and switch between the two. - For LCP, there has to be some interactivity like hover and click on the page, to do that we’ll use Puppeteer’s exposed
hoverandclickAPIs.
The whole process in our code would look something like the following:
// Neat way to manage web-vitals package version,
// simply update your package.json file and redeploy
// for it to reflect in your web vitals assessment.
const dependencies = require("./package.json").dependencies;
await page.addScriptTag({
	url: `https://unpkg.com/web-vitals@${dependencies["web-vitals"]}/dist/web-vitals.iife.js`,
	id: "web-vitals-script",
	type: "text/javascript",
})
const getPageWebVitals = async (page, browser) => {
	await Promise.all([
		page.waitForFunction("window.webVitals !== undefined"), page.waitForFunction("window.webVitals.onFCP !== undefined"),
		page.waitForFunction("window.webVitals.onCLS !== undefined"), page.waitForFunction("window.webVitals.onTTFB !== undefined"),
		page.waitForFunction("window.webVitals.onLCP !== undefined"), page.waitForFunction("window.webVitals.onFID !== undefined"),
	]);
	await page.evaluate(() => {
		const getAttributableElementData = (element) => {
			if (!element) return null;

			const { tagName, className, id } = element;
			const innerHTMLExtract = element.innerHTML.slice(0, 100);
			return {
				identifier: `${tagName}${className ? "." + className : ""}${
					id ? "#" + id : ""
				}`,
				innerHTMLExtract,
			};
		};
		const stringifyAndParseValueFromWindow = (key) => (value) => {
			try {
				if (key === "CLS" && value.entries.length) {
					value.entries = value.entries.map((entry) => ({
						...entry,
						sources: entry.sources.map((source) => ({
							...source,
							node: getAttributableElementData(source.node),
						})),
					}));
				}
				if (key === "LCP" && value.entries.length) {
					value.entries = value.entries.map((entry) => ({
						...entry,
						element: getAttributableElementData(entry.element),
					}));
				}
				window[key] = JSON.parse(JSON.stringify(value));
			} catch {
				return null;
			}
		};
		window.webVitals.onFCP(stringifyAndParseValueFromWindow("FCP"));
		window.webVitals.onCLS(stringifyAndParseValueFromWindow("CLS"));
		window.webVitals.onFID(stringifyAndParseValueFromWindow("FID"));
		window.webVitals.onLCP(stringifyAndParseValueFromWindow("LCP"));
		window.webVitals.onTTFB(stringifyAndParseValueFromWindow("TTFB"));
	});
	// Create an interaction event to trigger metric events like LCP and FID
	await Promise.all([ page.hover("body"), page.click("body") ]);
	// Create a visibilityState change event to trigger metric events like CLS and INP
	const newTab = await browser.newPage();
	await newTab.bringToFront(); // Switch to different tab.
	await page.bringToFront(); // Switch back to page's tab
	await newTab.close(); // Close other tab.

	await wait(500);
	const webVitals = await Promise.all([
		page.evaluate("window.FCP"), page.evaluate("window.CLS"), page.evaluate("window.INP"),
		page.evaluate("window.FID"), page.evaluate("window.LCP"), page.evaluate("window.TTFB"),
	]);

	return webVitals;
};
Measuring Total Blocking Time
When it comes to metrics like Total Blocking Time and Speed Index, we can’t rely on the web vitals library to measure them for us.
So we’ll trigger a separate process to get their values and then combine them with our web vitals array to send back to our client.
For total blocking time, we’ll make use of the Long Task API that’s part of the Performance APIs that are exposed to us by the browser.
const getTotalBlockingTime = async (page) => {
	const totalBlockingTime = await page.evaluate(() => {
		return new Promise((resolve) => {
			let totalBlockingTime = 0;
			new PerformanceObserver((list) => {
				const perfEntries = list.getEntries();
				for (const entry of perfEntries)
					totalBlockingTime += entry.duration - 50;
				resolve(totalBlockingTime);
			}).observe({ type: "longtask", buffered: true });
			// Resolve with total blocking time value if there aren't any long tasks in 3.5 seconds
			setTimeout(() => resolve(totalBlockingTime), 3500);
		});
	});

	return totalBlockingTime;
};

module.exports = getTotalBlockingTime;
Getting a list of assets and their sizes after the page loads
Lighthouse also gives a list of assets (CSS, Images, JavaScript files etc) that load during the performance assessment of the page and their sizes. This is immensely helpful when you’re trying to cut down the overall size of the page.
For us, getting this list is fairly easy, we can do so using any of the following two:
- Intercept requests using Chrome Dev Tools protocol (That we earlier used to throttle network connection speed)
- Use the puppeteer’s inbuilt
requestandrequestfinishedevents and mount listeners on them to get information about the request URL and the response size.
As a plus, we can also get a list of the requests that started but did not even resolve to give our users an idea of assets so large that they didn’t even load through the entire duration of the page assessment.
We will follow the same pattern that we used for screenshotting the page phases, we will mount a function to intercept all requests and start adding information to a list, and at the end, we’ll trigger a function returned by our interceptor to get that final list.
const MAX_TIME_TO_ASSESS_ASSETS = 3500; // Accept requests till 3.5 seconds after page navigation completes

function interceptAssetsOnPage(page) {
	let stillIntercepting = true;
	let startedInterceptingRequestsAt = new Date().getTime();
	const [requestsStarted, requestsResolved] = [new Set(), new Set()];
	const assetsAndAPICallsSizeAssessmentPromises = [];

	const onRequestStarted = async (request) => {
		if (new URL(request.url()).pathname !== "/" && stillIntercepting)
			requestsStarted.add(request.url());
	};

	const onRequestFinished = async (request) => {
		const requestURL = request.url();
		if (new URL(requestURL).pathname !== "/" && stillIntercepting) {
			const requestSizeAssessmentPromise = new Promise(async (resolve) => {
				requestsResolved.add(requestURL);
				let responseSize = request.headers()["Content-Length"];
				const isRedirect = request.redirectChain().length;
				const isPreflight = request.method() === "OPTIONS";
				if (!responseSize && !isRedirect && !isPreflight)
					responseSize = (await request.response().buffer()).length;
				resolve({ url: requestURL, length: responseSize || 0 });
			});
			assetsAndAPICallsSizeAssessmentPromises.push(
				requestSizeAssessmentPromise
			);
		}
	};
	page.on("requestfinished", onRequestFinished);
	page.on("request", onRequestStarted);

	setTimeout(() => (stillIntercepting = false), MAX_TIME_TO_ASSESS_ASSETS);

	const resolveAndGetAllRecordedAssets = async () => {
		// This is to be called much later, by the time this function is called most assets would have already started loading.
		if (stillIntercepting) {
			// Wait till the function stops accepting requests.
			await wait(
				Math.max(
					startedInterceptingRequestsAt +
						MAX_TIME_TO_ASSESS_ASSETS -
						new Date().getTime(),
					100
				)
			);
		}

		return {
			assetsList: (
				await Promise.allSettled(assetsAndAPICallsSizeAssessmentPromises)
			).map((asset) => asset.value),
			requestsNotResolvedTillTheEnd: Array.from(requestsStarted).filter(
				(url) => !requestsResolved.has(url)
			),
		};
	};

	return { resolveAndGetAllRecordedAssets };
}
Getting other essential metrics
Puppeteer also exposes a useful list of metrics like total JS Heap size, how many nodes are there in the website and how much time the browser spent in painting layouts, it’s an extremely interesting list of values which we can retrieve and send over to the client to interpret and use as they please.
const otherUsefulMetrics = await page.metrics();
A list of these metrics is available here.
The final response and on building a simple dashboard
The response sent over by your controller will be a big one, given it contains screenshot information in base64 (So no file transfers have to happen), web vitals information, assets and files information and whatnot!
When information transferred over a network gets this big, the time it takes to send back the report itself starts getting longer and longer. And as such, it might be a good idea to adopt some of the following:
- Stream your response constantly instead of sending it all at once. Node.js has support for response streams where you continually keep adding chunks of your response data to the stream and that stream keeps getting forwarded to the client.
- You can split your assessment into multiple endpoints for screenshots, web vitals, assets etc. So different information can be sent over independently of each other. This provides a better UX and prevents the whole process from crashing because of one part of the assessment crashing, but causes more memory usage in terms of the number of puppeteer instances running (Which are not light BTW).
As for building a simple frontend dashboard, if you go to Pagespeed insights right now. You would see a very simple page with a very elegant performance analysis section. Building a simple front-end dashboard like this is not going to be that big of a task. 😛
The beauty is all the engineering that went behind building a great tool like it, most of which is hidden from the everyday user.
